Re-analysis of Dean Radin Inauguration Analysis |
|
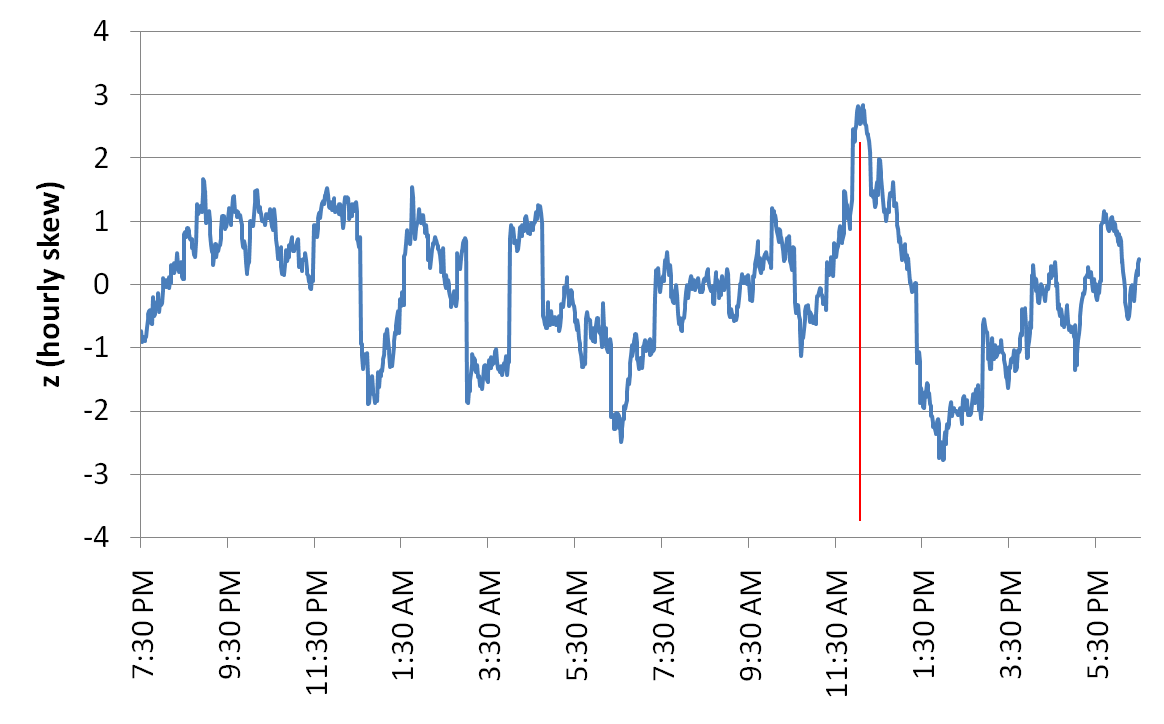
The following two graphs show an analysis by Dean Radin, looking at the shape of the data distribution represented by the skew statistic. See details of procedure here. Because we found some issues, detailed below, I asked Dean for some feedback. Dean added some further comments which are in the "details of procedure" linked above. He specifically rejects criticism based on issues like multiple testing, selection of free parameters, selection of test statistic, use of bootstrap stats, etc. The first figure shows the smoothed skew measure from 7:30 am to about 6:00 pm. The moment Obama took the oath of office as the 44th President of the United States is marked with a vertical line. A persistent rise begins about half an hour earlier and peaks almost exactly at the time of the oath, 12:05 pm.
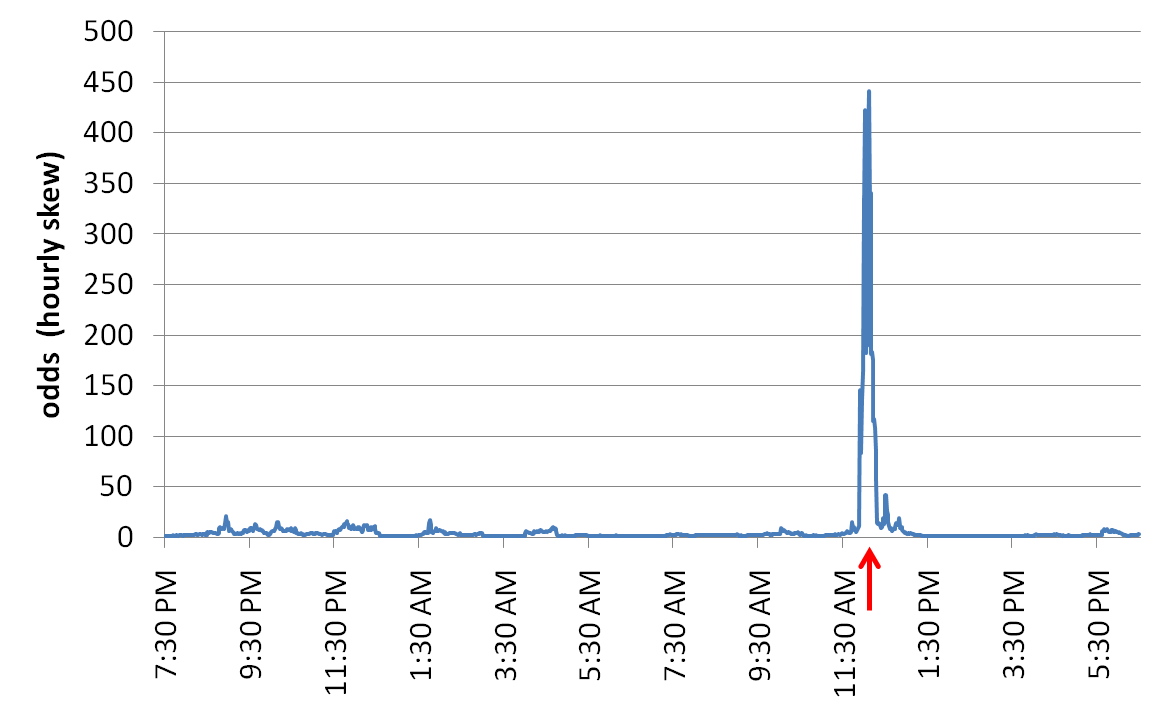
The next figure shows the same data, but now in the form of calculated odds against chance for the divergence from expectation. An arrow marks 12:05 pm, the moment of the oath. The spike is obvious, and rises to odds of about 450 to 1 that the increase in the skew coefficient is not just chance fluctuation. Of course the remarkably precise timing relative to an event that was the "bated breath" focus of huge numbers of people makes it even more remarkable. We acknowledge of course that post facto analysis procedures don't have the weight of pre-defined analyses, but we are not looking here at the result of "data snooping" but a well defined and useful exploration of the GCP data generated during the inauguration.
Re-analysis of Dean's ProcedureThis exploration presents an analysis that, while very impressive, isn't as rigorous as the GCP formal presentations. Indeed it has some issues that lessen the impact, and it is worth knowing about them. There is a "spike" near the swearing in, but it's biggest contribution is from a point several minutes earlier (~11:49) that is swept in by the smoothing process. The following is a re-analysis by Peter Bancel discussing method and interpretation, and including some figures giving a more complete and more rigorous view. Basics: Dean is looking for a deviation in the skewness of the trial variance. He does this by calculating the skewness of 1-minute devvars (as z-scores) in a 1-hour moving window. Dean finds a maximum odds value of 440-to-1 near the oath ceremony which he finds is a striking coincidence. My concern is that this may give a false impression that a global consciousness effect is registered in the network data at this moment. What follows is an effort to explain the concern. Dean looks at smoothed skewness fluctuations for a standard normal variable with N=60. He then identifies a 440-to-1 peak in the odds ratio near the Oath as meaningful. Here are 6 random simulations of Dean's procedure. That is, the procedure is applied to completely random data. On these plots the oath would occur at position 1020:
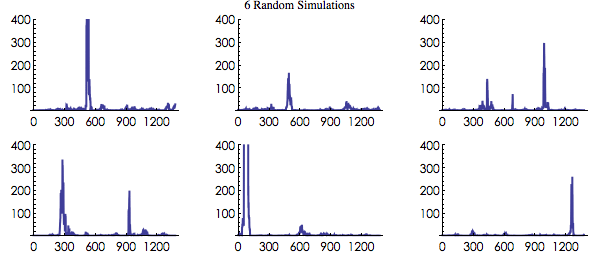
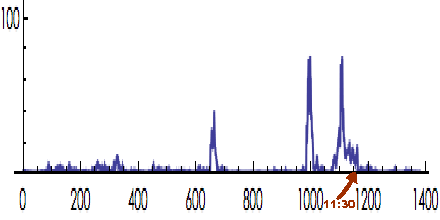
It's clear that this is a procedure whose null behavior is to produce odds peaks of the size he's found. The third plot here has a peak falling by chance quite near the "oath" position. My guess-timate is that the chance of an odds peak landing near the oath is about 1 in 10 (given the hour-long smoothing). That is my main point. But the odds peak value may be overstated to a substantial degree. First, he did 2 analyses, skewness and StoufferZ, so the odds needs to be reduced by 1/2. Since this is a unique test, it probably would be most appropriate to look at it as a two-tailed probability situation. Dean says he expected high skewness but as far as we know there isn't anything like this in the literature or in other work to justify a one-tailed test. There is no obvious analytical relation between 'coherence', 'order' or other such notions and the direction of skewness of the data distribution. You might claim that high skewness means that there are trial variance z-scores with high value, and that this is indicative of an increased devvar z-scores he's testing for. But that's not true. The skewness doesn't correlate with the z-scores in any simple way (except for the 3rd moment, of course...). A sound and justifiable procedure would specify that probability tests must be 2-tailed unless he predicted in advance, preferably via an analytical argument, for high skewness. Correcting for two analyses means that the odds ratio needs to be reduced 2x, from 440 to 220. Using the arguably correct 2-tailed probability estimate would reduce it by another factor of 2 to 110. There are some minor corrections that might be made by using more accurate estimates for the transformations of variance and skewness to Z-scores. One can say that quick and convenient approximations are OK for explorations, but it is worth noting that such calculational differences in this case amount to more than 20 percent. If all the corrections and revised estimates are applied, the final value of the odds ratio is about 76 to 1 with a corresponding Z score of about 2.2. Of course this is still a significant statistic for a peak that is near an important moment. The remaining question is whether that location in time is driven by the moment. Finally, here's a plot of Dean's procedure using the calculations, corrections and probability methods I described. Some structure appears that is not in Dean's analysis because I'm doing 2-tails and negative z-scores contribute. Remember any "null" plot will look roughly the same and the only issue on the table is whether one wants to argue that the placement of a given peak relative to the day's events has any meaning.
|