Intention Experiment Sept 11-18 2011 |
|
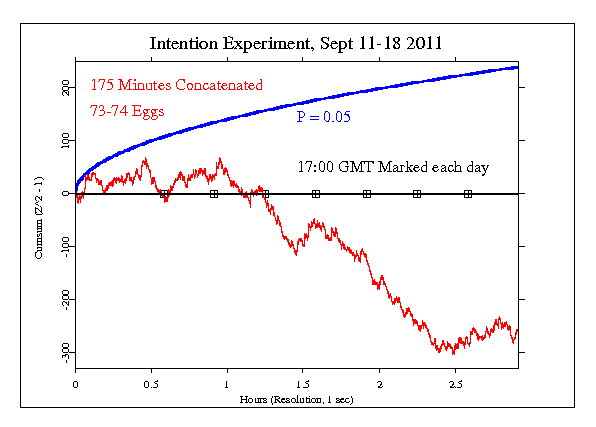
Lynne McTaggart wrote to ask "if it might be possible for you to look a little more closely at your GCP figures just during the 20 minute window of time each of the day of the eight-day experiment (9/11/11-9/18/11). I ask because you did that for our 2008 experiment, and I’m trying to replicate exactly what we did again as closely as possible." She provided the exact times, shown below, which included 35 minutes for the 11th of Sept. and 20 minutes for the other days. The period on each day began at 17:00 GMT. I concatenated the 8 days of data to make a sequence 175 minutes long. The statistics calculated as if this were a formal experiment show Chisquare 10239 on 10500 df, for p = 0.965 and Z = -1.808.
Sep 11, 2011

5 pm GMT (6 pm UK summer time) 1 pm Eastern Daylight Savings Time 1 PM EDT
5:20 PM GMT (6:20 pm UK time) Page flips to Target page (showing two provinces of Afghanistan) 1:20 pm EDT
5:25 pm GMT (6:25 pm UK time) page flips to Intention page with music (People hold the intention to lower violence in the two provinces for 10
minutes) 1:25 pm EDT
5:35 pm GMT (6:35 UK time) page flips to Thank you and end of experiment page 1:35 pm EDT

Other Days (Sept 12-18, 2011)

5 pm GMT (6 pm UK summer time) 1 PM EDT
5:05 PM GMT (6:05 pm UK time) Page flips to Target page 1:05 pm EDT
5:10 pm GMT (6:10 pm UK time) page flips to Intention page with music 1:10 pm EDT
5:20 pm GMT (6:20 UK time) page flips to Thank you and end of experiment page 1:20 pm EDT

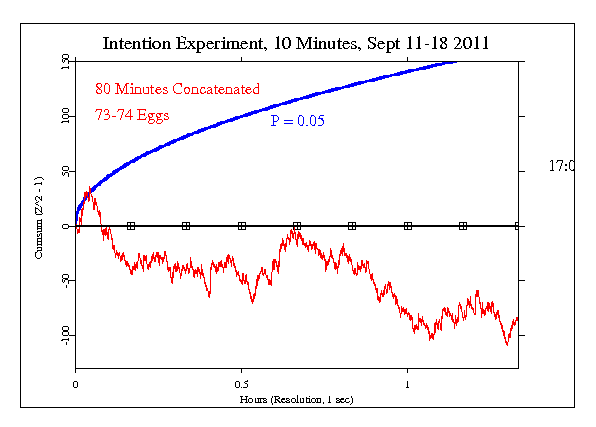
The GCP data have a small signal to noise ratio (the putative effect size is very small compared to the inherent random noise). As a result, individual experiments and small datasets like this one can't be reliably interpreted. Deviations which appear in our graphic displays are a combination of possible effects and ordinary random fluctuation. Therefore, to gain useful perspective and greater statistical leverage, it is valuable to look at other events with a similar nature. In this case, a previous Intention Experiment shows virtually the same negative trend in the cumulative deviation graph. That is, we see again a tendency for the GCP data to show deviations from expectation that are slightly negative. This similarity across the two experiments helps support an interpretation of the negative deviations shown in the current dataset as an effect linked to the Intention. The last 10 minutes in each period shown above were specifically given to the Intention, and the next figure shows the concatenation of those periods only. The result is similar in character, with a tendency for the deviations to be smaller than expected, yielding a downward trend in for the cumulative deviation. The statistics show a smaller composite deviation than for the full 20-minute periods in the previous graph, with Z = -0.896 and p = 0.815.

It is important to keep in mind that we have only a tiny statistical effect, so that it is always hard to distinguish signal from noise. This means that every "success" might be largely driven by chance, and every "null" might include a real signal overwhelmed by noise. In the long run, a real effect can be identified only by patiently accumulating replications of similar analyses.
|